The Aiera Monitor Gallery
Aiera’s Research Team is always busy building comprehensive and powerful monitors that cover a variety of topics relevant to any analyst. From ESG Monitors to live feeds of corporate actions, Aiera's Monitor Gallery has something to suit every analyst's coverage interests.
These Monitors are easily searchable via the Aiera Monitor Gallery. Simply click "Gallery" on the navigation bar, and the Monitor Gallery will appear, as shown below:
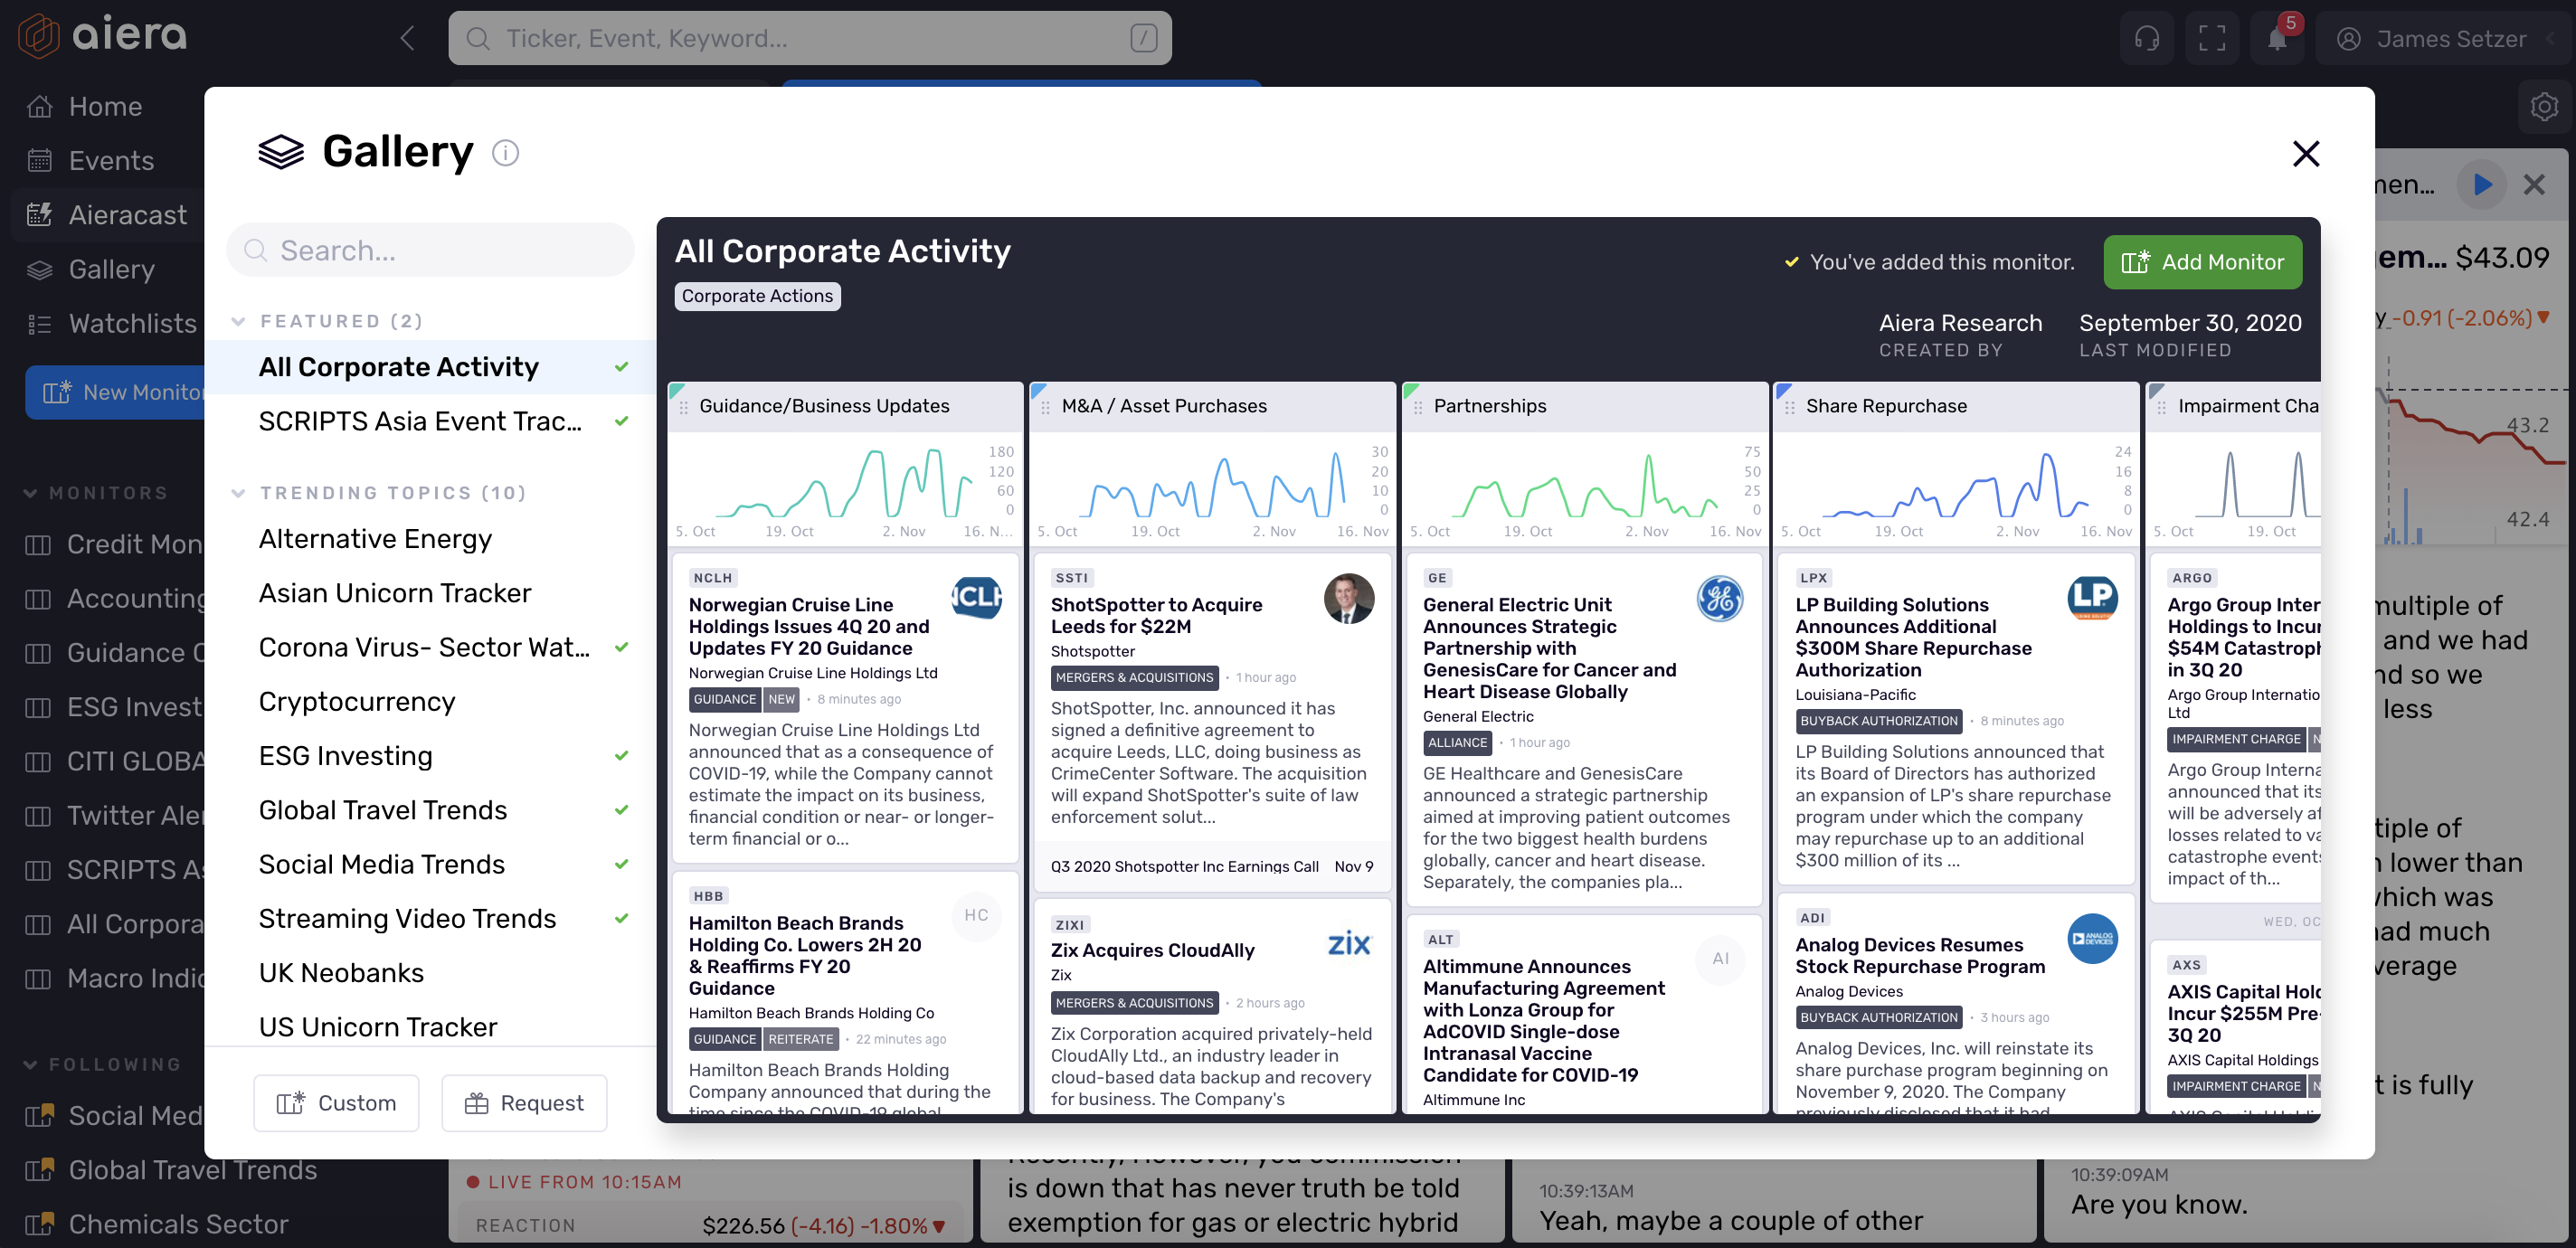
Browse Monitors That Suit Your Interests
Along the left side, you can easily scroll and browse across a variety of monitors and topics, including:
- Featured Monitors
- New and relevant monitors
- Trending Topics
- Current events
- Corporate Activities
- M&A announcements, partnerships, etc.
- Business Activities
- Accounting irregularities, guidance revisions, etc.
- Global Impact Monitors
- Macro trends, COVID-19 impact, etc.
- Sector Monitors
- Chemicals, oil & gas, etc.
- Equity-Specific Monitors
- AMZN, GOOG, etc.
- And much more...
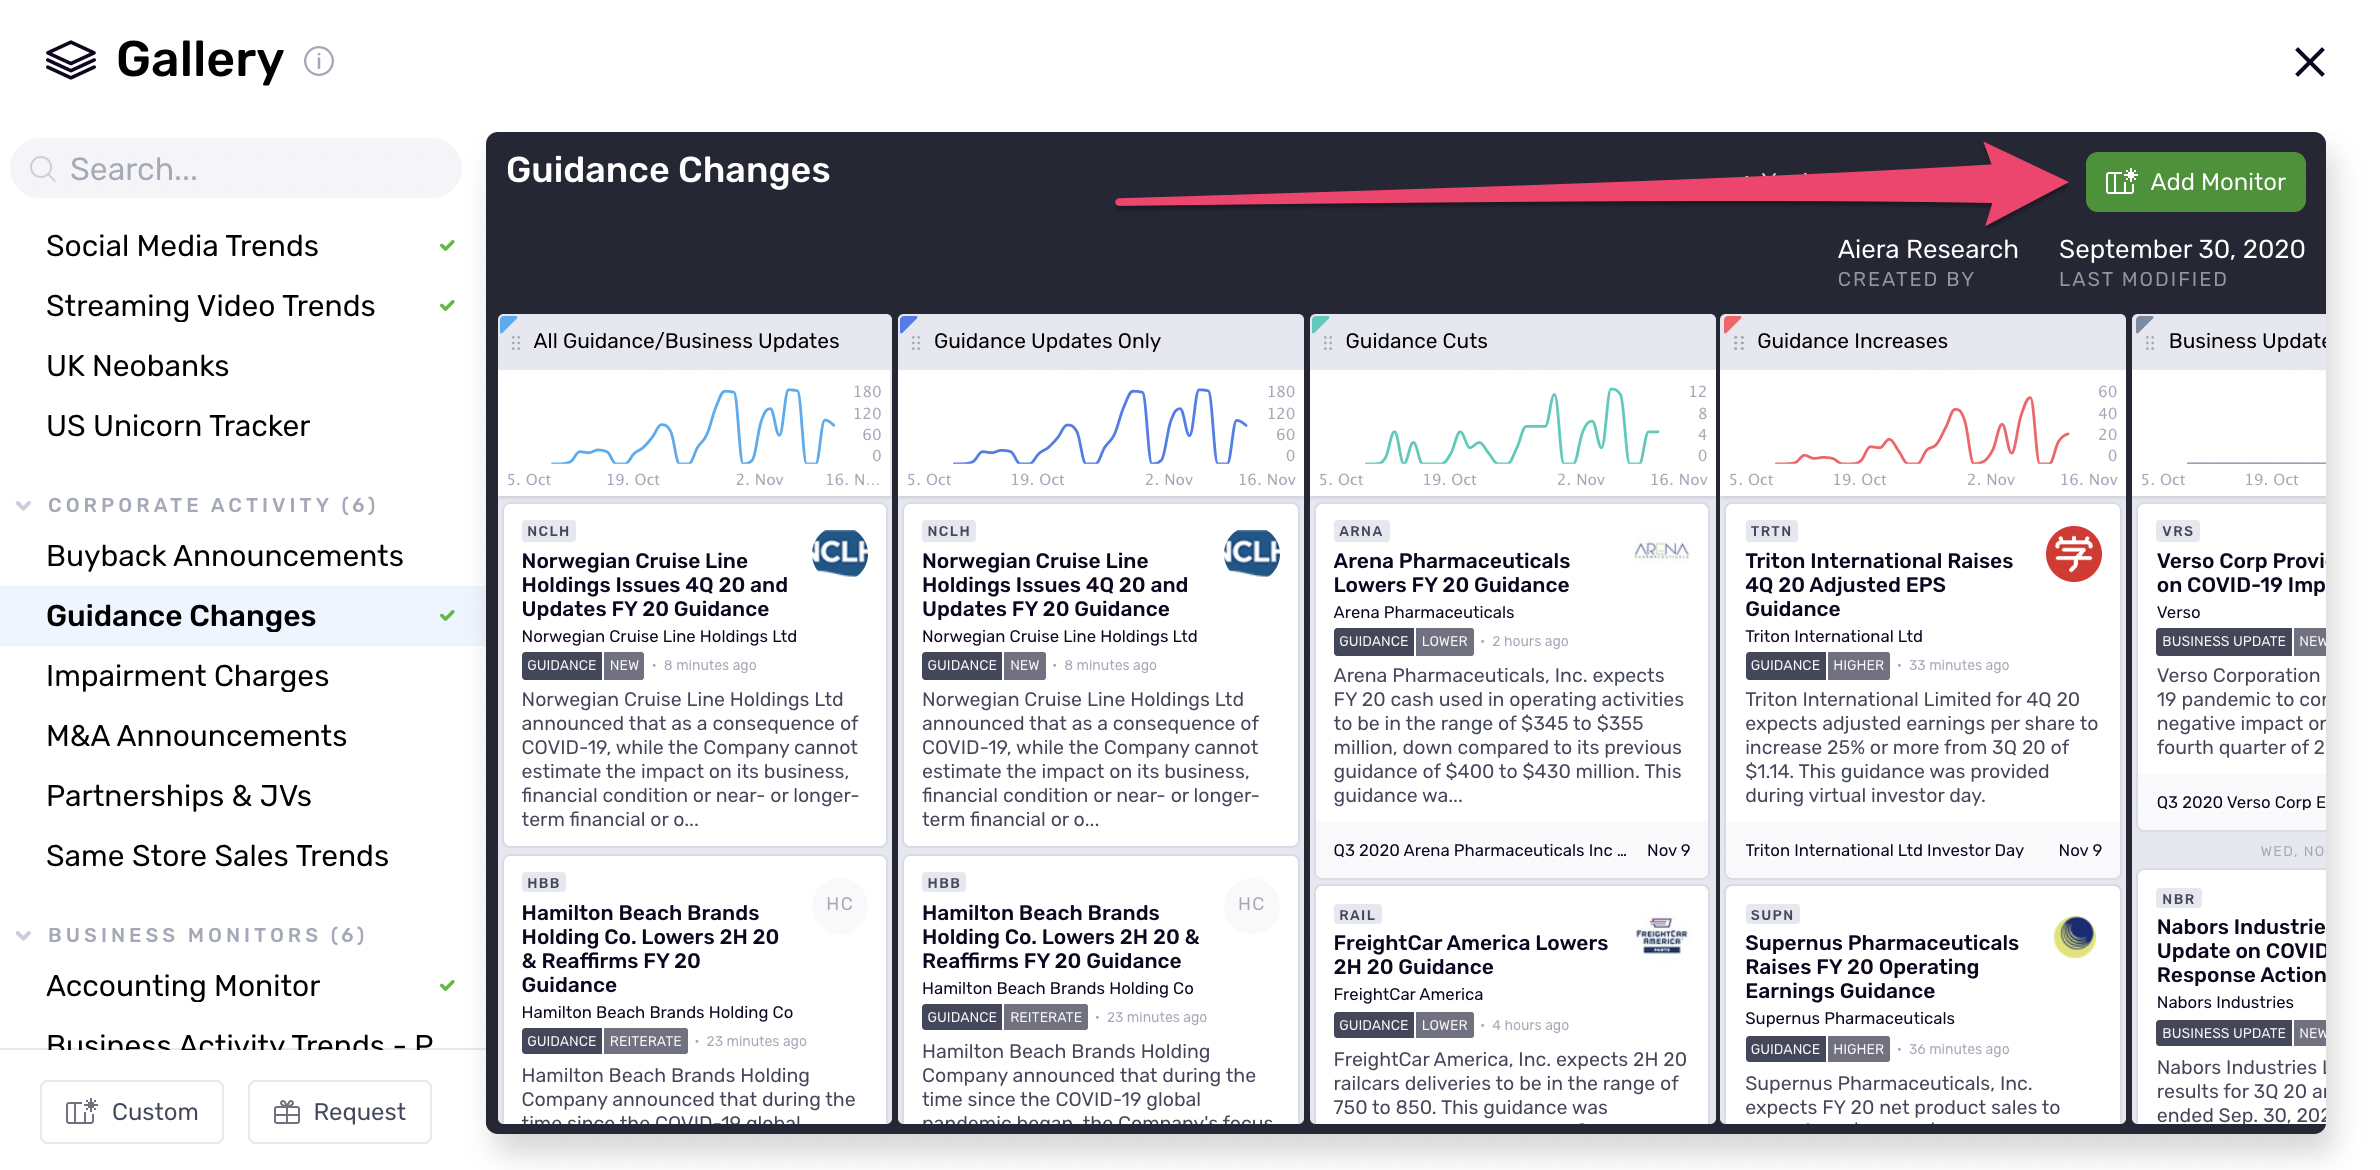
Add A Monitor To Your Dashboard
Once a Monitor has piqued your interest and you'd like to learn more about it, simply click the green "Add Monitor" button in the top right of the Gallery to add it to your Aiera experience.
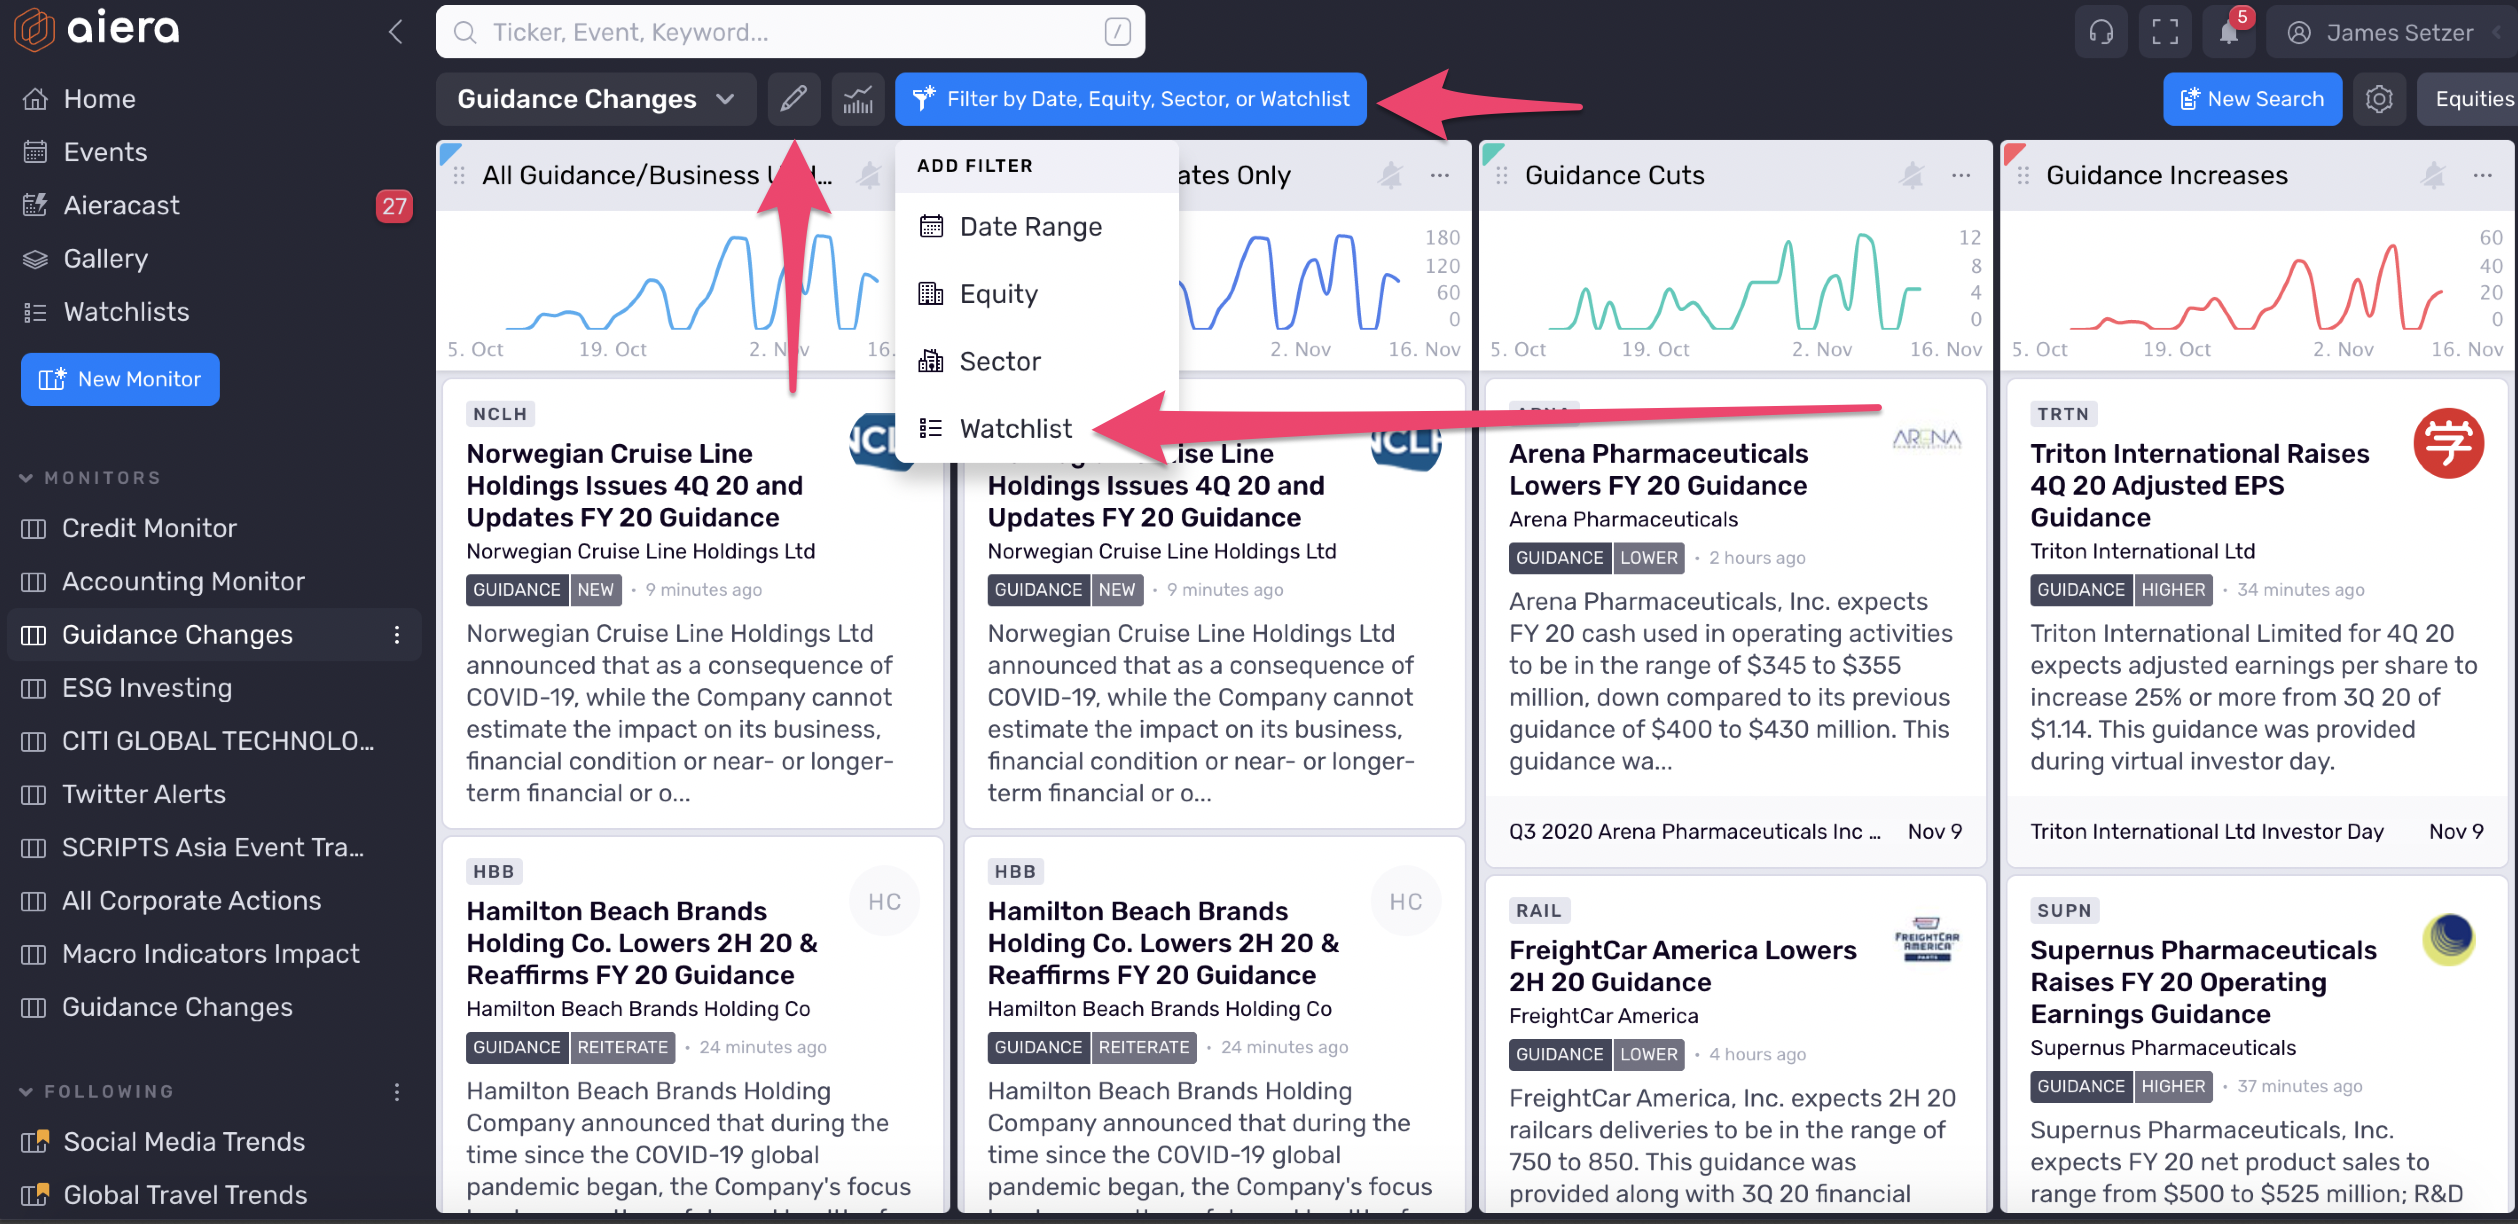
Now, Make The Monitor Work For You
Once you have added the Monitor, it will appear on the left-hand navigation bar. Click into the Monitor to start fine-tuning.
By default, each Monitor is set to pull information from Aiera's global library of 10,000+ public equities. In order to make these monitors as relevant as possible for you, some editing and filtering will likely be necessary.
These are the two most common ways to edit and filter a new monitor:
- Click the pencil icon to edit the name, description, accessibility, and more for the Monitor.
- Click the blue "Filter By..." button to quickly scope these streams and searches to any of your watch lists, any sector, a specific equity, or a date range.
Search within the Monitor - You can also quickly search for key terms and mentions using the search bar at the top of the monitor. All results and matches within the monitor will quickly appear on your screen.
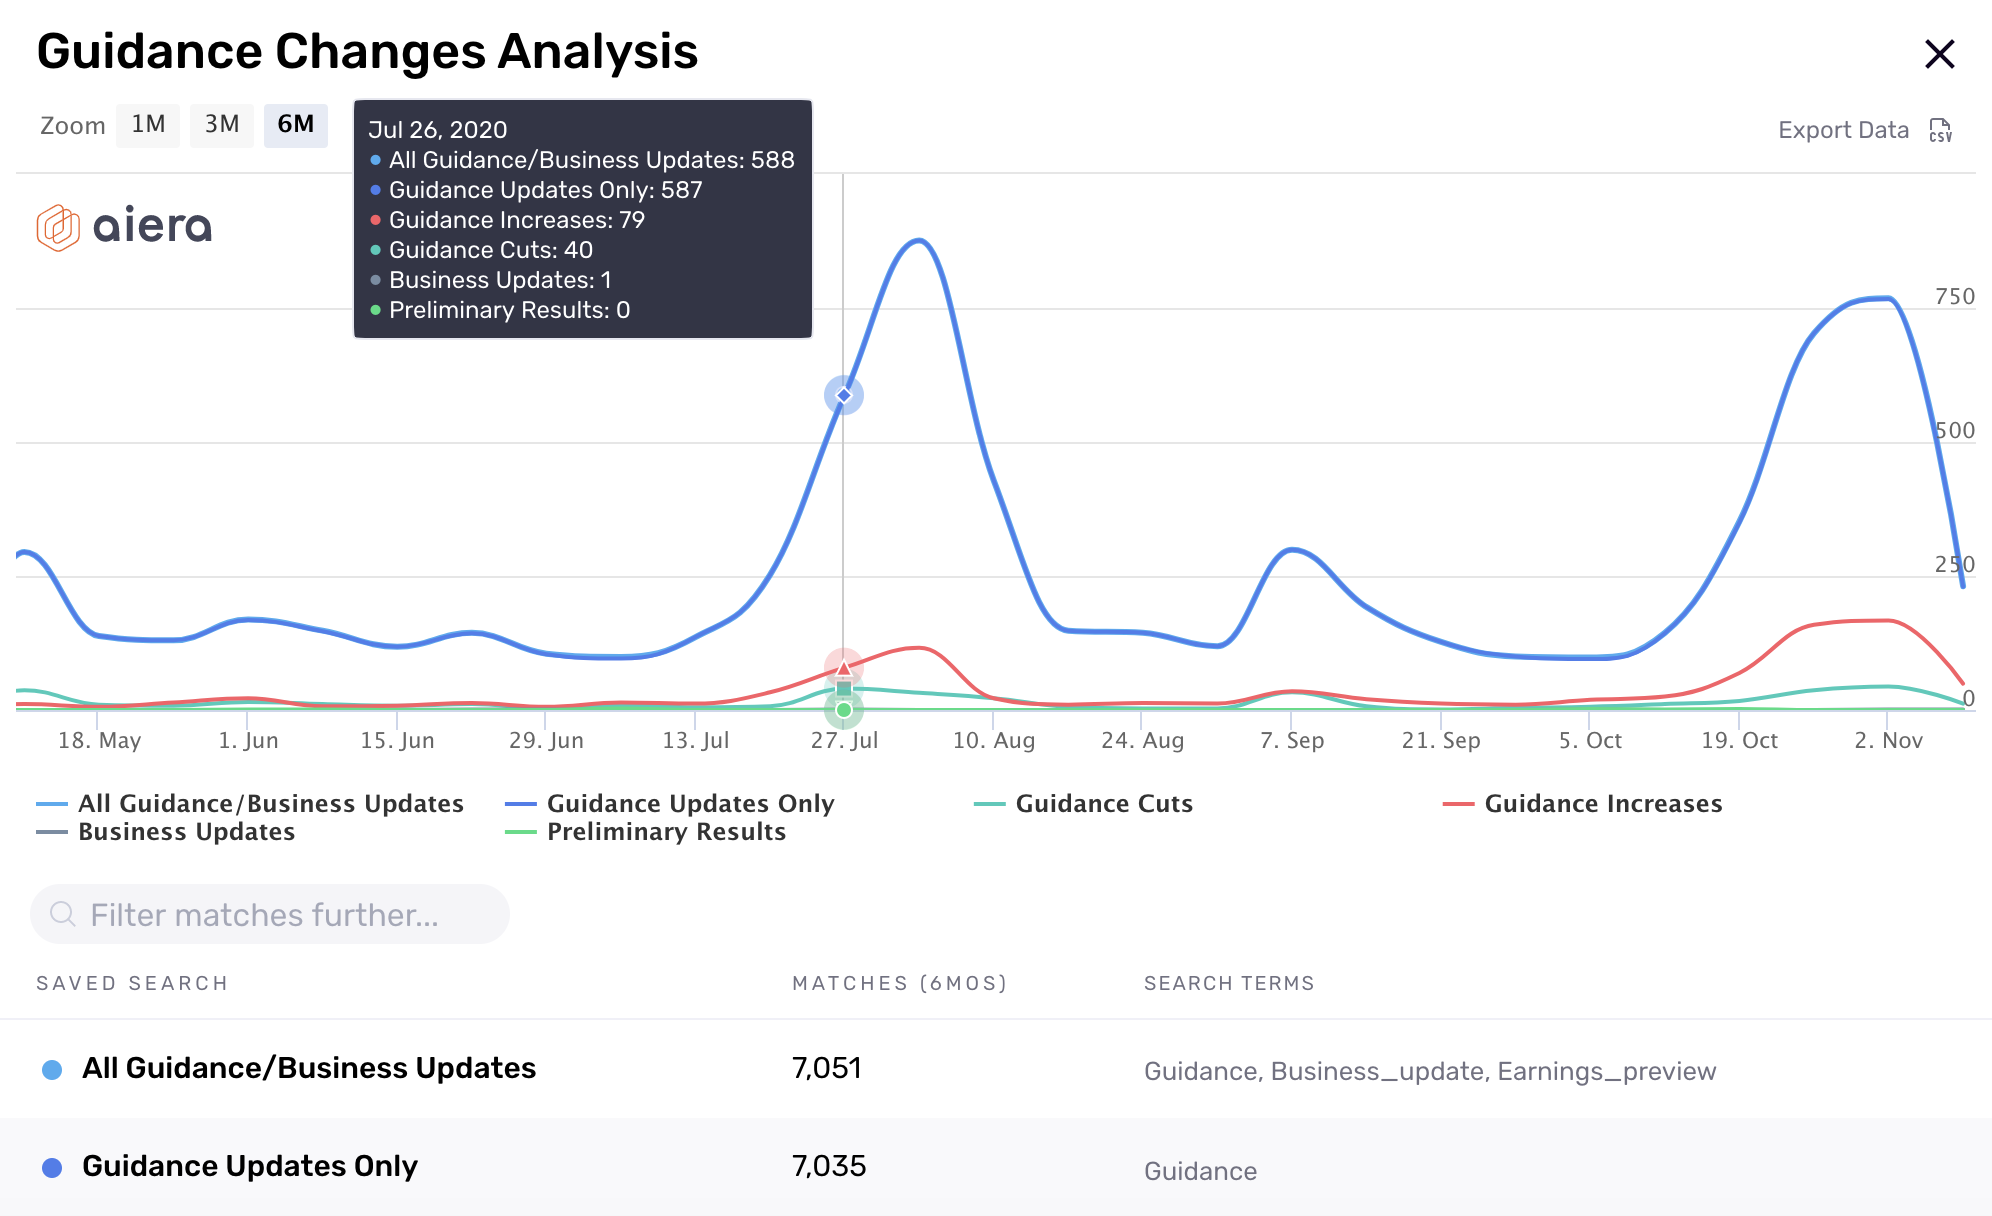
Visualize Your Monitor
Click the "Charting" button at the top of the Monitor to view a visualization of the number of stream matches and mentions related to your specific filters and parameters. Chart matches from the past month to the past six months easily.
- The interactive chart allows you to select and deselect certain streams to show up in the visualization
- Follow along the trend lines for daily totals of matches and mentions
- Click "Export Data" in the top right to export a .CSV file to easily manipulate the data further in the tool of your choice
Request Your Own Custom-Made Aiera Monitor
Have a special request, but don't know where to begin? Premium Aiera users can easily request a topic of a monitor they would like to use, and Aiera's in-house research team will quickly create it for you. Simply click "Request" in the bottom left side of the Monitor Gallery to request your own!
Not a premium member? Don't fret, you can create your own Monitor yourself! Read our article titled "Building Custom Monitors."